Home
> The Economy > US unemployed for over 26 weeks 1969 – 2011: chart of the day
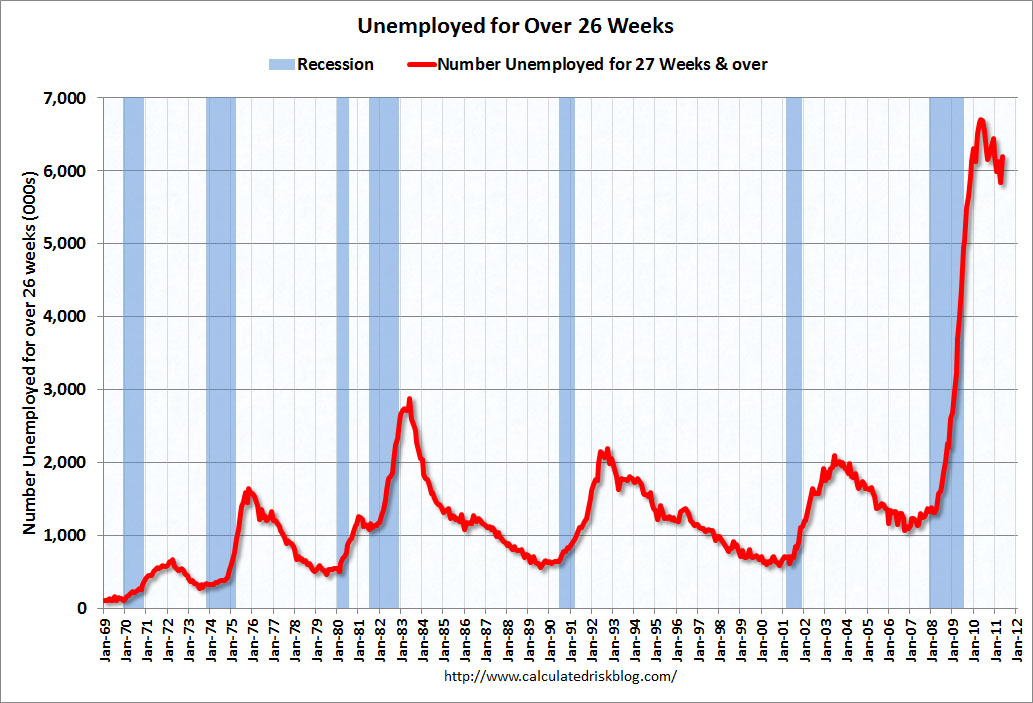
US unemployed for over 26 weeks 1969 – 2011: chart of the day
Leave a comment


—– look inside —– $5.94 / $20.00

—– look inside —– $4.90 / $8.00

—– look inside —– $15.99

—– look inside —– $5.99 / 12.99

—– look inside —– $5.93 / $12.99

—– look inside —– $4.97 / $9.90

—— Ugarteche, Puyana and Madi ——

Gerson Lima / Maria Alejandra Madi

Edward Fullbrook and Jamie Morgan

————— Michael Hudson ————–

Maria Alejandra Madi / Jack Reardon

————- Edward Fullbrook ————-

—————— Steve Keen —————–

————— Richard Smith —————

————– Gustavo Marques————

– Victor Beker and Beniamino Moro –

————– Lars Pålsson Syll ————-

—————– Stuart Birks —————-

Edward Fullbrook and Jamie Morgan

———— Armando Ochangco ———-

Shimshon Bichler / Jonathan Nitzan

————— Mauro Gallegati ————–

————— Herman Daly —————-

————— Asad Zaman —————

—————– C. T. Kurien —————

————— Robert Locke —————-


Amen.
Regularly recurring recessions – there must be something wrong with the system.If this was an engine any competent mechanic would soon diagnose the problem and fix it.
Bloody Impressive chart!
BIS quarterly leaves no more doubts on German history of delay tactics concerning Greece.
Click to access r_qt1106.pdf
Utterly disgusting, disgrace, you name it, to read on their demands for more austerity and selling of assets. They just don’t care about people loosing jobs and income, all this BS talk about stability and growth, they are so disconnected from the real world in their fantasy economy, the god damn spread sheet schizophrenics…. sorry, it really gets to me at times…. They are slaughtering Greece, simple as that. :(
Forgot to say, as for BIS, german banks in it for E23bln.