Archive
11th out of 11
from David Ruccio
The U.S. healthcare system ranks dead last out of 11 countries studied by the Commonwealth Fund [ht: ja]. Read more…
Labor surplus vs. efficiency wages in th United States
from David Ruccio
The current situation—what I continue to refer to as the Second Great Depression—presents a real problem for mainstream economists. Read more…
Horns of a dilemma
from David Ruccio
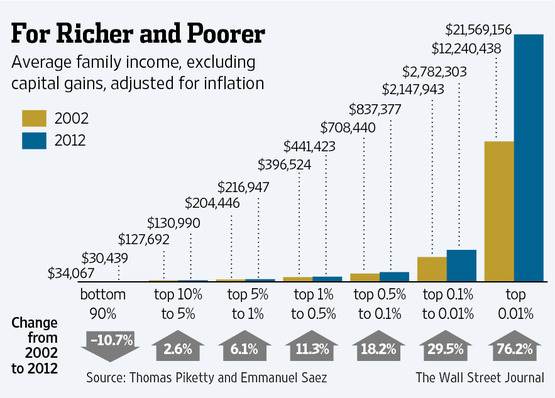
The Wall Street Journal notes that rising inequality may pose a problem—because of issues like fairness, political dysfunction, and financial instability. Read more…
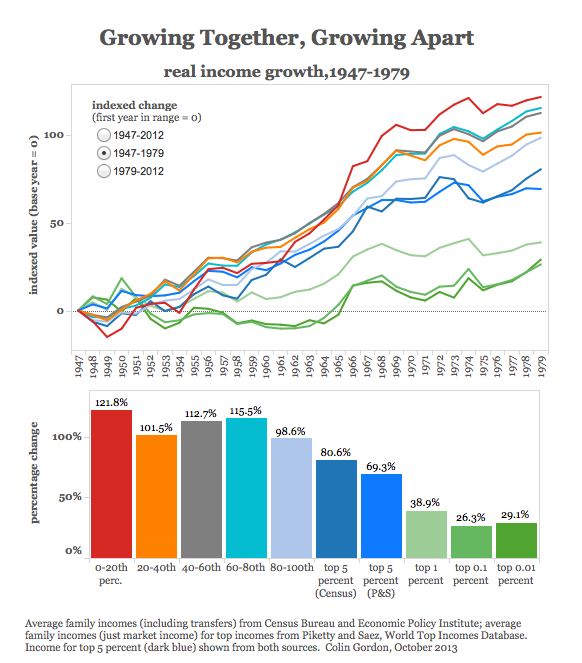
Two American epochs: Growing Together 1947-1979 and Growing Apart 1979-2012 (charts)
from David Ruccio
Shutting down the government over health care
from Dean Baker
Much of the media, and certainly the Democrats, have been unfair to the Republicans in Congress in characterizing their decision to shut down the government as “outrageous,” “crazy,” or even “terrorism.” It is undoubtedly an extraordinary measure, but sometimes extraordinary measures are warranted.
Suppose we were back in 1968 when the United States had more than 500,000 soldiers in Vietnam and was bombing the country on a daily basis, killing thousands of people every week. How many people would view it as outrageous if Congress had voted to shut down the government until President Johnson agreed to end the war? In fact, most people might view the inconveniences associated with a shutdown, and the real pain endured by government workers, to be justified if it could bring an end to the killings in Vietnam.
The difference between shutting down the government to end an unjust war, or to advance any of the other great causes of recent decades, and what the Republicans are doing now is that the Republicans don’t have a great cause. They are trying to keep people from getting health care. This is the disaster the Republicans hope to prevent by shutting down the government. Read more…
Mid Summer Blues
from Peter Radford
No I haven’t disappeared. This is mid-summer and the living is supposed to be easy. And it would be were it not for the perpetual lunacy in Washington. I wonder whether America has ever been this ill served by its collective leadership.
Last week were treated to an outpouring of enthusiasm based upon the new GDP numbers. Growth was 1.7%. Wow. In normal times, back before the banks trashed the economy, the endless bailouts, various fiscal showdowns, tepid reforms, and Congressional gridlock – you know all those years ago – a 1.7% growth rate would have been greeted as the harbinger of bad times. Now, in our new world, people get almost giddy over it. Such is the distortion to our perspective that the failure of our leadership has wrought that we genuinely laud a weak report. It is as if we are so starved that any small morsel looks like a veritable banquet.
How did America get to be so small? Read more…
+74.2% to the top 5%, -1.5% to the middle fifth, 1983–2010 – USA
USA share of total household wealth growth accruing to various wealth groups 1983-2010

Source: http://stateofworkingamerica.org/chart/swa-wealth-figure-6b-share-total-household/
The broken link (2 graphs)
Josh Bivens today has an excellent post The Compensation/Productivity Link Is Indeed Broken for the Vast Majority of American Workers at the Economic Policy Institute Blog. The post includes these to graphs pertaining to the US economy.
Greece’s unemployment rate by month (graphics)
from David Ruccio
The unemployment rate in Greece [pdf] climbed to a new record high of 26.9 percent in April (significantly higher than the 23.1 percent registered in April 2012), while the youth jobless rate is now a truly dire 57.5 percent (up from 51.5 percent a year ago)! Read more…
The decline in real wages in the USA 2009 – 2012 (2 charts)
from David Ruccio
According to the National Employment Law Project [pdf], for the period from 2009 to 2012: Read more…
The USA is 27th (chart)
from David Ruccio
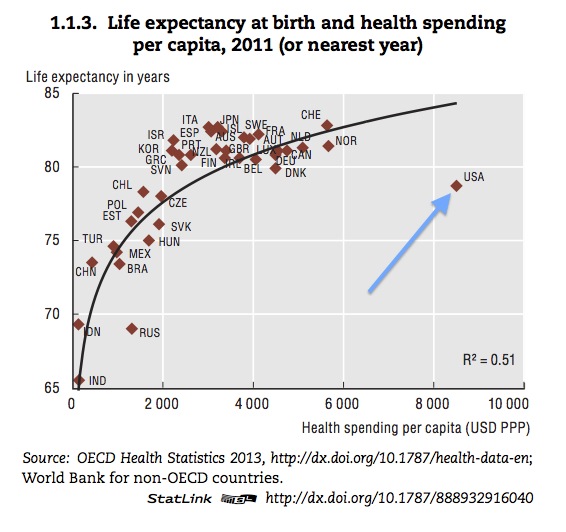
The usual excuse, from mainstream economists and politicians, that the U.S. healthcare system should remain mostly in for-profit, private hands is because the outcomes of that system make it the best in the world.
But a new study (published in the Journal of the American Medical Association) of the burden of diseases, injuries, and leading risk factors in the United States from 1990 to 2010 in comparison to the other countries in the Organisation for Economic Co-operation and Development (OECD) countries reveals a quite different story.
So how did we do compare to other countries? Read more…
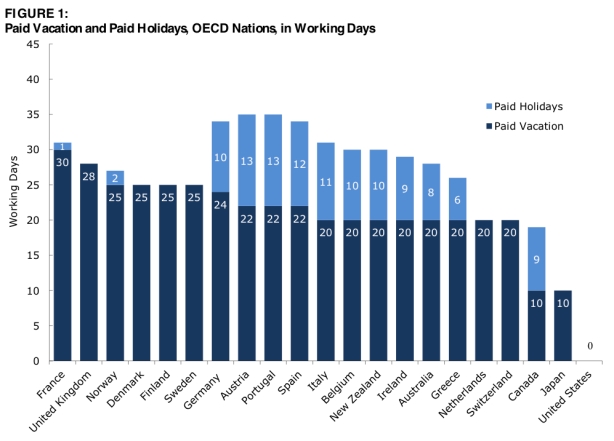
“The United States is the only advanced economy in the world that . . .”
Deep Sleep and Other News
from Peter Radford
“the rotten economics that brought us the crisis has not been purged”
With the US immersed in one of its weekly presidential elections – they seem to be that frequent – nothing substantial can be done about our malaise. No one wants to do anything for fear of inciting a tsunami of attack ads, venomous deformations of the truth, and contorted definitions of what is actually going on. Too much is at stake for anyone to make a move. So we drift instead. This is more a function of the extraordinary divide in our politics than it is of the electoral system itself, but it is, nonetheless, the primary cause of our problems. While we clearly have an ideological battle being waged within economics, it pales by comparison to that in our politics. Until one side or the other emerges victorious, or at least sufficiently dominant to do what it proposes, we will be stalled. That, I think, could take a decade or more.
The only person in Washington to talk much about our problems this week was Read more…




 (
(





Recent Comments