The new Eurostat data on labour flows: more ‘job churn’ is not the answer.
Main point: changes in net labour flows do not seem to be related to the level of unemployment which means that at least part of total unemployment can be called ‘involuntary’
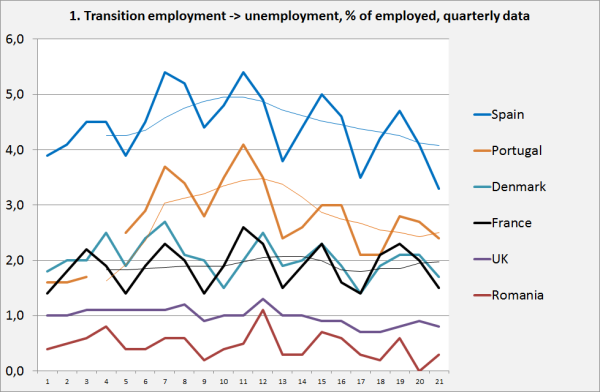
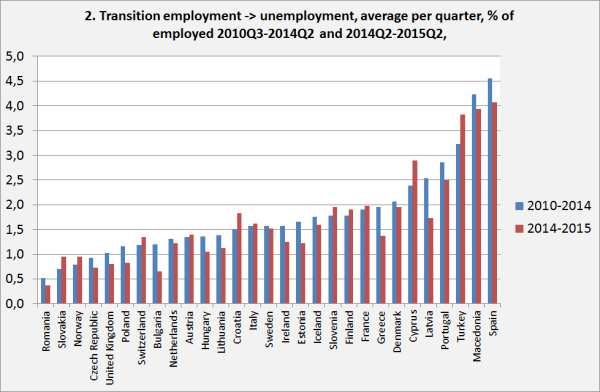
On October 26 Eurostat published an important new European statistic on labour flows (on October 24 this blog had a little scoop). Such data is/are not entirely new. But it is the first time a consistent data set for Europe is available. The data require very thorough investigation, this blogpost is mainly intended to draw some attention to them. Graph 1 shows quarterly job turnover in the EU countries with the highest (Spain, Portugal) and lowest (Romania) job churn as well as for some large countries and Denmark, which is supposedly the country which most enthusiastically embraced the ‘flexicurity’ agenda: cut job and income security and increase employability of the unemployed as well as the employed. Graph 2 shows data for all countries. Data for Germany are, alas, not available.Total flows consist of flows into and out of employment, unemployment and inactivity, only one of these flows is shown here.
The data (plural, as there are different data for different countries and the pattern shown by the graphs is shaped by a myriad of individual data about individual people) show:
A) Very large and consistent differences between countries. Compare France and Spain, which both have a large tourism sector – seasonal patterns are very comparable but levels show large but consistent differences.
B) ‘Large’ is in this case defined as ‘sometimes two to three times as large as historical changes for an individual country’. The decline of the (quarterly!) flow out of employment into unemployment in Spain of not even 1% of the employed is consistent with the difference between a rapid increase of unemployment and a rapid decrease of unemployment while the difference between Spain and France is about 2% per quarter (or 8% per year) but the lower level in France is not consistent with a decline of unemployment in France. I.e.: differences between countries are much larger than differences within countries consistent with a rapid increase/decrease of unemployment (the change of the rate of unemployment is of course also ‘explained’ by flows out of unemployment into employment and into and out of inactivity but that’s not the point here).
C) At this moment I can’t explain the differences. No doubt, the sector structure of the economy is important (tourism!). But laws and habits or the age structure of the population and the like are no doubt important too. The differences however show that a simple comparison of national data is not possible, the information can only be understood taking institutional differences into consideration. There are however country specific semi-stable flows between the three sectors, which mainly seem to be related to total employment.
D) With this caveat in mind it is remarkable that the country with the lowest ‘job churning’, Romania, has relatively low unemployment – much lower than for instance Portugal and Spain, two countries with very high ‘job churning’. Many countries with (in an EU perspective low or relatively low unemployment (Czech Republic, the UK, Austria, the Netherlands) are on the left side of graph 2!
E) Of course, C) in combination with D) means that the idea that countries have to increase the flexibility of the labour market to drive down unemployment has to be reconsidered.
F) Graph 2 shows, again, that differences between countries are larger than historical differences within a country. Which is, when you think about this, an argument in favor of the idea of involuntary unemployment. Even when flows into and out of unemployment are very high, like in Spain and Portugal, which means that the composition of unemployment changes all the time, the level of unemployment is still pretty tenacious (even despite lower flows into unemployment out of employment as well as inactivity and higher flows out unemployment into employment and inactivity in Spain, unemployment is still 20%+). To state this differently: the level of unemployment is ‘non-flexible’. Pumping up the volume during a musical chairs session won’t increase the number of chairs.
G) Which is underscored by the data on the UK and Denmark, which are supposed to have extremely flexible labour markets. The institutional structure of these countries (habits, culture, economic sectors, debt levels, whatever) seems however to prevent ‘Spanish’ levels of job churn, which is consistent with, in a EU perspective, relatively low unemployment (Denmark is however bordering on a situation of outright high unemployment). The point: it’s not just about laws and written rules.


November 02, 2015
Very interesting and well structured data analysis, Mme. Merijn Knibbe.
It tends toward empirically confirming the contents of TELOS & TECHNOS on the subject. It’s part of a much larger body of empirical data that points in the same direction, without explicitly intending to do so. All of this gradual accumulation of not so “raw” knowledge,{{much more than just “information” }supports the ridiculing of the “Natural rate of unemployment” {Friedman’s folly } in TELOS & TECHNOS. And points toward a method of separating the consequences of “job churn” and local transitional influences, from the hard permanence of change in the Natural Participation Rate.
Norman L. Roth, Toronto Canada.
Please GOOGLE [1] Norman L. Roth, TECHNOLOGICAL TIME {2} Norman L. Roth, Economics of Work [3] Norman L. Roth, Current Conception of the Standard of Life