U.S. manufacturing jobs and trade: A tale of two graphs
from Dean Baker
The first decade of this century was pretty awful for U.S. manufacturing workers. In December of 1999 we had 17.3 million manufacturing jobs. This number had fallen to 11.5 million by December of 2009. This amounted to a loss of 5.8 million jobs, or one-third of all the manufacturing jobs that had existed at the start of the decade. That looks like a pretty big deal.
It’s also worth pointing out that most of these jobs were lost before the onset of the Great Recession. We had lost almost 4 million jobs by December of 2007, the official start date of the Great Recession. The obvious culprit here is the explosion in U.S. trade deficit that we saw in this decade. If we’re buying more goods from other countries, in general, that means we are producing fewer goods here.
It’s also worth noting that even the manufacturing job loss that resulted from Great Recession may have a substantial trade component. Manufacturing is always highly cyclical. We lose manufacturing jobs in a downturn, but get them back when the economy recovers. That didn’t happen with the recovery from the Great Recession.
This matters because manufacturing was traditionally a heavily unionized sector. Due to its high unionization rate, manufacturing jobs paid a wage premium over jobs in other sectors. This was especially important for workers (primarily male workers) without college degrees. Manufacturing was an important source of high-wage jobs for workers with less education.
The lost jobs in this period were disproportionately unionized jobs. In 2022, the unionization rate in manufacturing was just 7.8 percent, only slightly higher than the 6.0 percent rate for the private sector as a whole.
Anyhow, that’s the story from the standpoint of someone who thinks our trade policies have done real harm to a large group of workers. It is possible to paint a different picture.
Suppose we look at manufacturing employment as a share of total employment. Here’s that picture.

It doesn’t look like anything special is going on in the first decade of this century. The manufacturing share of employment had been dropping for decades. The 00s don’t look very different from 1970s, 1980s, and 1990s. What is there to complain about?
This is the graph that proponents of U.S. trade policy like to tout. But there is another graph. This one just shows manufacturing employment since 1970.
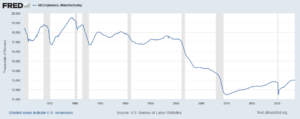
While there are cyclical ups and downs in the prior three decades, there is only a modest downward trend over this period. That changes in a big way when we get to the 2000s. You can’t look at this graph (or at least I can’t) and say that the 00s were just more of the same.
This was the period where we saw a massive loss of manufacturing jobs in places like Ohio, Michigan, Pennsylvania, and Wisconsin. The economy looked very different in these states at the end of the decade than it did at the start of the decade.
I will make one other point here. No one should say that the issue here was “globalization.” There are an infinite number of ways that we can increase the integration of the U.S. economy with the rest of the world. For example, we could reduce our patent and copyright protections so that U.S. technology, especially in areas like health care and climate, can be more easily shared with the rest of the world.
We can also focus our trade deals on standardizing licensing requirements for professional services, so that foreign doctors, dentists, and other professionals from the rest of the world can more easily practice in the United States. This would offer the textbook “gains from trade,” but the losers would be workers in highly paid professions and the rest of us would be gainers.
But we chose not to go this route with our trade deals. Trade deals were focused on making it as easy as possible to import manufactured goods, putting our manufacturing workers in direct competition with low paid workers in China, Mexico, and elsewhere.
This had the predicted and actual effect of costing millions of manufacturing jobs and sharply reducing the pay in the ones that remain. But this was not a story of “globalization.” It was a story of crafting trade deals in a world where doctors and other professionals have much more political power than manufacturing workers.
Leave a comment


—– look inside —– $5.94 / $20.00

—– look inside —– $4.90 / $8.00

—– look inside —– $15.99

—– look inside —– $5.99 / 12.99

—– look inside —– $5.93 / $12.99

—– look inside —– $4.97 / $9.90

—— Ugarteche, Puyana and Madi ——

Gerson Lima / Maria Alejandra Madi

Edward Fullbrook and Jamie Morgan

————— Michael Hudson ————–

Maria Alejandra Madi / Jack Reardon

————- Edward Fullbrook ————-

—————— Steve Keen —————–

————— Richard Smith —————

————– Gustavo Marques————

– Victor Beker and Beniamino Moro –

————– Lars Pålsson Syll ————-

—————– Stuart Birks —————-

Edward Fullbrook and Jamie Morgan

———— Armando Ochangco ———-

Shimshon Bichler / Jonathan Nitzan

————— Mauro Gallegati ————–

————— Herman Daly —————-

————— Asad Zaman —————

—————– C. T. Kurien —————

————— Robert Locke —————-


The most important graph is not Employment in Manufacturing in the US. This graph just shows the EFFECTS of the way we have implemented globalization. The most important graph is that of the US Current Account Balance which, by definition, defines the US Capital Account Balance. (https://data.worldbank.org/indicator/BN.CAB.XOKA.GD.ZS?locations=US) This graph shows why the way in which we have implemented globalization has led to the fall in employment in manufacturing in the US shown in the Employment in Manufacturing graph which the Current Account graph mirrors.
Specifically, the Current Account graph shows the extent to which foreign individuals, corporations, and central banks have used their current account receipts to purchase US assets (i.e., real estate, stocks, bonds, etc.) to keep US exchange rates artificially high thereby keeping foreign wages and prices artificially low relative to US wages and prices as explained in the Appendix of https://www.rweconomics.com/htm/_themes/htm/WDCh_2.htm.
I do not understand why economists talk about this problem without discussing the need for capital controls to keep the capital account near balanced in such a way as to normalize relative wages and prices between the US and foreign countries. I see no other way to deal with this problem.
Perhaps someone can tell me what I am missing here?
Eurodollars?
There is some need for this imbalance since other countries need to be able to accumulate FX reserves, but the problem is excessive magnitudes, and that countries are hiding what they are doing.
According to latest revelations China has 6 trillion in reserves instead of 3, and who knows what other countries got. What would happen if they were all to sell them at the same time? Very least thing we could demand from them is total transparency.
Oversized reserve accumulation hurts everybody, and send to be a result of thinking stuck in a very dim place, as if this is excellent economic development strategy, which it is really not, and reserve system were never intended to be used this way. And these policies are decided by handful of people behind closed doors, while millions suffer from consequences like diminished purchasing power.
We would need honest debate whether any of this makes any sense.