Home
> upward income redistribution > Income redistribution in the United States 1913-2011 (2 graphs)
Income redistribution in the United States 1913-2011 (2 graphs)
from David Ruccio
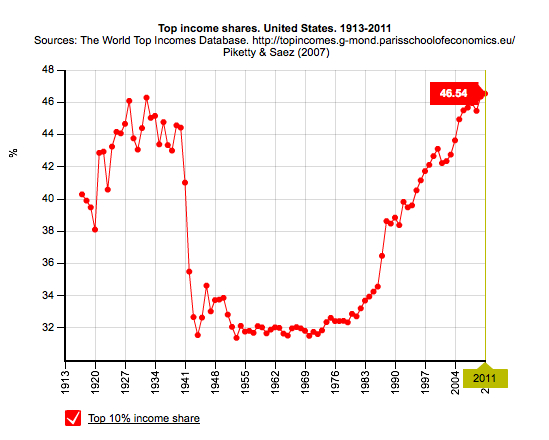
The Great Recession in the United States only depressed top income shares temporarily and, based on data through 2011, will not undo any of the dramatic increase in top income shares that has taken place since the 1970s. Indeed, excluding realized capital gains, the top decile income share in 2011 was equal to 46.5 percent, the highest ever since 1917.
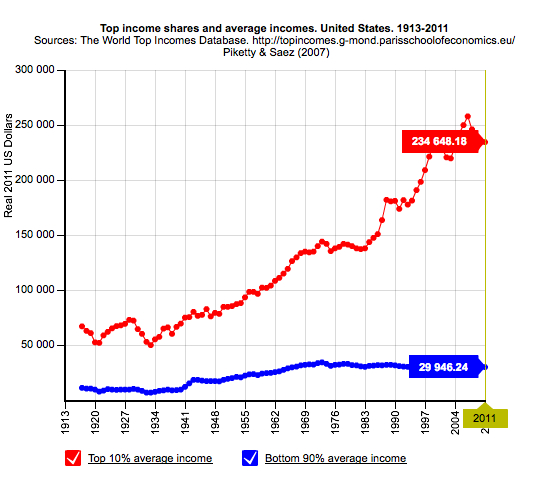
This is what average incomes for the top decile and the rest—the bottom 90 percent—look like over the entire period:
Leave a comment


—– look inside —– $5.94 / $20.00

—– look inside —– $4.90 / $8.00

—– look inside —– $15.99

—– look inside —– $5.99 / 12.99

—– look inside —– $5.93 / $12.99

—– look inside —– $4.97 / $9.90

—— Ugarteche, Puyana and Madi ——

Gerson Lima / Maria Alejandra Madi

Edward Fullbrook and Jamie Morgan

————— Michael Hudson ————–

Maria Alejandra Madi / Jack Reardon

————- Edward Fullbrook ————-

—————— Steve Keen —————–

————— Richard Smith —————

————– Gustavo Marques————

– Victor Beker and Beniamino Moro –

————– Lars Pålsson Syll ————-

—————– Stuart Birks —————-

Edward Fullbrook and Jamie Morgan

———— Armando Ochangco ———-

Shimshon Bichler / Jonathan Nitzan

————— Mauro Gallegati ————–

————— Herman Daly —————-

————— Asad Zaman —————

—————– C. T. Kurien —————

————— Robert Locke —————-


Nice work. But could you please try the first graph with an added indicator? The Top 1% earners. We shall see that 10% of the 13% gain from like 32% share of all US income to 45% was created by the Top 1% earners. You are involving the top 9% of US population which did not see that much of an increase.
Transition in the financial system coupled with the unipolar world building, after the fall of Berlin wall, could explain the acceleration of the inequality process in the 90s. Need for a welfare state around the world have fallen into peaces as the wall.
So was possibly made the stance of the End of the History and the reign of the happy few and the elites…
Economy has political and strategic motivations. Piloting economy is quite well known along major pieces of work in economics ; problems have arisen from resurgence of class conflicts and the ability to capture resources in a global world.
Mystification of economic rhetoric, thanks to rational expectation (denying uncertainty) was the main strategical tool. Experts and economists were trapped in dishonest propaganda and academic reviews are dishonorably testimonies of the process. We are still waiting for self-criticism in the professional arena before more economic disruptions would be recorded and societies destroyed.
Very interesting data.
One could add another important dimension in income distribution, namely the capital/labor divide. According to one study, labor’s share of income decreased from 75 percent in 1979 to 67 percent in 2007 (http://www.cbo.gov/sites/default/files/cbofiles/attachments/10-25-HouseholdIncome.pdf).
Translating this within the Marxian conceptual framework, one might say that the rate of exploitation has increased from 1/3 to about ½ — that is roughly a 50 per cent increase in exploitation between 1979 and 2007.
(See also: http://www.clevelandfed.org/research/commentary/2012/2012-13.cfm)
Check this out: Top 1% Increase Share of US Income 120%
Using 2007 post-tax dollars, the wealthiest 1% of the US population increased their share of the nation’s income 120% between 1979 and 2007. The top 20% grew their share about 30%, while every other income group decreased their share. Most notably, the bottom 20% lost about 30% of their share of the nation’s income.
Americans Misperceive Wealth Distribution
Read more:http://www.marketingcharts.com/direct/wealthiest-americans-dramatically-increase-income-16296/
Another interesting point:
The Wealth Distribution
In the United States, wealth is highly concentrated in a relatively few hands. As of 2010, the top 1% of households (the upper class) owned 35.4% of all privately held wealth, and the next 19% (the managerial, professional, and small business stratum) had 53.5%, which means that just 20% of the people owned a remarkable 89%, leaving only 11% of the wealth for the bottom 80% (wage and salary workers). In terms of financial wealth (total net worth minus the value of one’s home), the top 1% of households had an even greater share: 42.1%. Table 2 and Figure 1 present further details, drawn from the careful work of economist Edward N. Wolff at New York University (2012).
Read more:http://www2.ucsc.edu/whorulesamerica/power/wealth.html
DO YOU THINK WE ARE DOING SOMETHING WRONG??
Justaluckyfool says, “The Wealth of a Nation is in HOW it redistributes its Wealth”.
pretty clear no one knows what equitable means…….
if the rich want it all….then the “99%”….should live for free…..be housed, fed, clothed, entertained……
Is there a model which can explain this trend? Based on this data, can econometric model predict what would happen in the nearest future?