Home
> income inequality > In the USA when income grows, who gains? 1976 – 2008 (chart)
In the USA when income grows, who gains? 1976 – 2008 (chart)
from David Ruccio
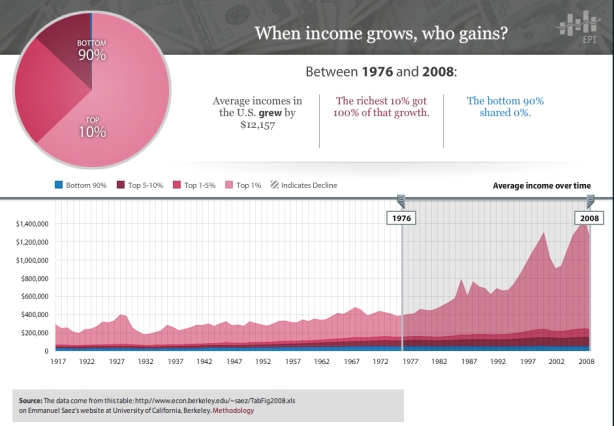
That’s right: 100 percent to the top 10 percent and zero for everyone else.
Leave a comment


—– look inside —– $5.94 / $20.00

—– look inside —– $4.90 / $8.00

—– look inside —– $15.99

—– look inside —– $5.99 / 12.99

—– look inside —– $5.93 / $12.99

—– look inside —– $4.97 / $9.90

—— Ugarteche, Puyana and Madi ——

Gerson Lima / Maria Alejandra Madi

Edward Fullbrook and Jamie Morgan

————— Michael Hudson ————–

Maria Alejandra Madi / Jack Reardon

————- Edward Fullbrook ————-

—————— Steve Keen —————–

————— Richard Smith —————

————– Gustavo Marques————

– Victor Beker and Beniamino Moro –

————– Lars Pålsson Syll ————-

—————– Stuart Birks —————-

Edward Fullbrook and Jamie Morgan

———— Armando Ochangco ———-

Shimshon Bichler / Jonathan Nitzan

————— Mauro Gallegati ————–

————— Herman Daly —————-

————— Asad Zaman —————

—————– C. T. Kurien —————

————— Robert Locke —————-


David, that’s more extreme than I have seen elsewhere. What happened to median real income. If in fact the bottom 90% got NONE of the growth, then median real income should be flat for the entire period. I thought it had gone up — just not by much.
It isn’t clear what is meant here by “average income”? Is is household income or individual? If it is the latter, that may be the explanation for the discrepancy between this chart and the median household income stats Mike mentions.
what makes the top 10% think that are entitled to such a share and on top of Bush tax cuts as well ?
Looking at the excel file, I think the units are “tax units” rather than households, so that would explain the discrepancy.
One naive question: shouldn’t such figures relate cor-relatively (proportionately) to the changes in the money supply itself? I presume this began to fluctuate if not bifurcate after the Nixon Shock days 1971-1973 and the demise of the hard gold standard. The distribution of the money supply no longer had to have its solid footing on a fixed gold supply, and it seems that the graph indicates that the infrastructure maintained one level of money supply while finance (wealth) sectors became more liquid (or kept “floating” advantageously). Relatively fixed Scarcity at the lower end of the production economy that really establishes a credible baseline for the proportionate value of the money growth surging in the commercial /service / financial sectors from 1970 to 2012. This is not a “shift” in the economy that we are looking at…,
it’s a complete split and dichotomy in the political economy of the United States itself and its relationship to an international order.
What do we make of this framework:
Nixon abrogates Bretton Woods Agreement of 1944
1971
The fixed exchange rate was changed to a floating exchange rate for the US Dollar
Nixon wanted to make exports more competitive before the 72’ Election
Beginning of Financialization of the World Economy
————————————————
OPEC Oil Prices established
1973
Major factor in the world economy, second pike occurred in 79’
The US had supplied itself with gas before the 1960s.
————————————————
Consequences for World Economy after Fall of Organized Capitalism
1970 – 2012
-Biggest Firms are now mainly multinational or transnational
-Taxes rise in order to shelter profits
-With the rise of China, the majority of the FDI is barely established between core countries
-Product Life Cycle Model and Relocation of Labor Intensive Production
-Massive share of trade today is within firms
-Global supply chains have components from multiple sites and assembly lines
————————————————-
EDIT Plantations changing to Agribusiness
1970 – 2012
Capitalization of Export Agriculture and Resource Extraction
Shifting from Import substitution to local export-oriented manufacturing
Growth of Global Supply chain manufacturing
Capital Intensive Agriculture in ______
————————————————————
Changing Nature and Location of Jobs
1970 – 2012
The Industrial Reorganization of the Core (changing from technology to labor and moving offshore—> global supply chains)
Capital Intensity in manufacturing increased and labor intensive jobs were off-shored (new technology is as important as globalization in reducing manufacturing jobs; fewer jobs is a result of new technology NOT globalization)
Rise of Dual structure in the service sector
(producer & financial FIRE and consumer services)
Rise of Financial Services Industry, Driver of economic growth
Increase in Part time, decrease in full time jobs
(manufacturing jobs decrease, manufacturing increase)
Jobs moved to BIG cities and agglomeration economies are grouped
————————————————————————————–
http://www.preceden.com/timelines/38030-geography-4-globalization–regional-development-and-the-world-economy (all data)
I do not think that this graph is a profile of greedy winners and subordinate losers in a contest over salaries. I think it represents solid evidence of a ‘transition” and perhaps an actual transformation in the history of the United States and the stratification of not only society but the political economy itself.
But I have to disclose…I’m not an economist…its just a passing impression.
A two tier money allocation/distribution permits a pricing system that facilitates not only differential access to resources but also coordinate barriers to entry. Maintaining a free flow of liquidity in one sector acts as a caste system in monetary classifications (a $15 bridge toll to NYC now prevents entry for many people and acts as selective permits).
Austerity and scarcity of monetary liquidity in lower sectors not only suppresses allocation, but it establishes an inversely distributed value base for exploitation by the disproportionately privileged capital advantages in the wealth sectors that control finance.
In brief, one dollar in the lowest segments is more valuable than in the upper tiers, and the aggregate liquidity of wealth has the advantage of complete leverage over the scarcity below. Austerity, therefore, in the context of a disproportionate money supply actually increases the power of finance and control economies. This orchestrated advantage suggests that the dichotomies between austerity and wealth since 2007 are intentional and power structured orchestrations that are tantamount to colonizing entire domestic subsistence bases. Price structures emerging now reflect that process in real time and is insidiously isolating market demographics according to means and position in society.
By Prof Michel Chossudovsky
Global Research, December 19, 2012
“For this Orwellian New World Order to be sustained, realities must be turned upside down: the propaganda apparatus is predicated on instilling falsehoods in the minds of millions of people.
Citizens must accept the premises of a World Order where:
war is heralded as peace,
the police state is upheld as democracy,
austerity means prosperity,
wealth and luxury is a indicator of progress and development,
killing and torturing alleged terrorists are required to ensure national security
the victims of war constitute a threat to Western civilization
http://campaign.r20.constantcontact.com/render?llr=o8b4necab&v=001qcrdJaeP7TZlO_SbMYS3ASlgMqJD_rn24SEMhV5ALm_MNt3Vt-tk5QL-aprQfHT9FqMf52VOiwvOHfFiBpl5UDcochdZ9tZu-3eIhVkhcsQ%3D
http://seekingalpha.com/article/991631-it-s-the-interest-stupid-why-bankers-rule-the-world
“In the 2012 edition of Occupy Money released last week, Professor Margrit Kennedy writes that a stunning 35% to 40% of everything we buy goes to interest. This interest goes to bankers, financiers, and bondholders, who take a 35% to 40% cut of our GDP. That helps explain how wealth is systematically transferred from Main Street to Wall Street. The rich get progressively richer at the expense of the poor,…”
“…Bank assets, financial profits, interest, and debt have all been growing exponentially….”
It’s The Interest, Stupid! Why Bankers Rule The World
November 8, 2012 | by Ellen Brown
“By 2010, 1% of the population owned 42% of financial wealth, while 80% of the population owned only 5% percent of financial wealth. Dr. Kennedy observes that the bottom 80% pay the hidden interest charges that the top 10% collect, making interest a strongly regressive tax that the poor pay to the rich.
Exponential growth is unsustainable. In nature, sustainable growth progresses in a logarithmic curve that grows increasingly more slowly until it levels off (the red line in the first chart above). Exponential growth does the reverse: it begins slowly and increases over time, until the curve shoots up vertically (the chart below). Exponential growth is seen in parasites, cancers . . . and compound interest. When the parasite runs out of its food source, the growth curve suddenly collapses.”
http://seekingalpha.com/article/991631-it-s-the-interest-stupid-why-bankers-rule-the-world
THANK YOU,
Hope that millions share this.
Happy New Year; just…(but I think I will call you Justice!): Happy New Year…
Take this with you too:
DERIVATIVES AND OUR FINANCIAL SLAVERY IN A NUTSHELL
The $1.5 Quadrillion Dollar Derivatives Crisis, & Growing
http://bit.ly/UpVRUt
Financial Oligarchy and the New Robber Barons w/Derivatives Guru Janet Tavakoli